
Action required: The Continuous Data UI, API, and CLI are scheduled for end of life. Review the latest migration guidance and start planning your transition to Data Control Tower.
On new engine installations of 2026.5.0.0 and later, the Admin UI opens directly to the Performance Dashboard, and the Manage, Resources, and System menus are unavailable. Engines upgraded from an earlier version keep full Admin UI access. This restriction cannot be changed by customers; contact Delphix Support if you need it lifted temporarily.
Learn more about the Continuous Data end-of-life announcement.
Access the dataset performance graph
-
Log into the Delphix Management application.
-
In the Resources menu, select Dataset Performance.
-
Use the controls described below to view statistics and their related graphs.
Dataset Performance graphs display throughput in bits per second (b/s, Kb/s, Mb/s). Performance Analytics graphs display network throughput in bytes per second.
General graph display and controls
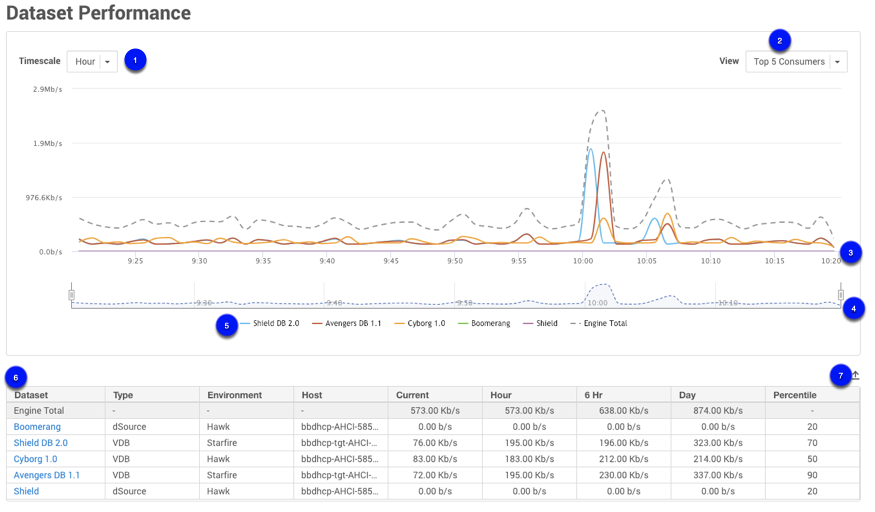
Graph controls
-
Timescale: Select from hour, 6 hours, day
-
View: View data by top 5 consumers or by the 75% percentile
-
Dateline: Displays timestamps of data points in the graph.
-
Timeline selector: Specifies the start and end time for the currently displayed data. The range displayed is controlled by selecting the slider. Drag the slider to view statistics for the specific time.
-
Graph legend: If more than one set of information is presented on the graph, Graph Legend displays a description and color for each set.
-
Dataset table: Displays the information for each Dataset in a table format. Selecting a Dataset link takes you to the Dataset Status page.
-
Export: Exports the displayed table data.
Interpret Dataset Performance data
Dataset Performance shows total network I/O throughput for reads and writes combined for the most I/O-intensive subset of datasets on the engine.
Each point on the graph represents an average over an interval that depends on the selected timescale. Throughput values can change when you switch timescales because each point represents an average over a longer or shorter interval.
The dataset table shows average throughput for each displayed dataset over the entire period represented by each Hour, 6 Hr, or Day column.